
2.6.1 Setting Up RDS Monitoring
Mx.Load allows users to collect metrics from AWS RDS Performance Insights in their environment and display metrics from load testing periods. This feature enables users to view both load testing data and RDS metrics on a single screen.
The metrics available for monitoring depend on the RDS engine. For details, refer to 2.6.2 RDS Monitoring Metrics.
NoteSetting up RDS monitoring requires prior completion of 2.5 Target Host Registration.
Specific setup steps for RDS monitoring are as follows:
- Create a role in the user’s AWS environment for Mx.Load to retrieve data.
- Register monitoring settings on the target host.
Following these steps allows viewing Performance Insights metrics from the target host’s load testing on the load testing detail screen.
RDS Monitoring Overview
Create a role from the AWS IAM Roles Management Console.
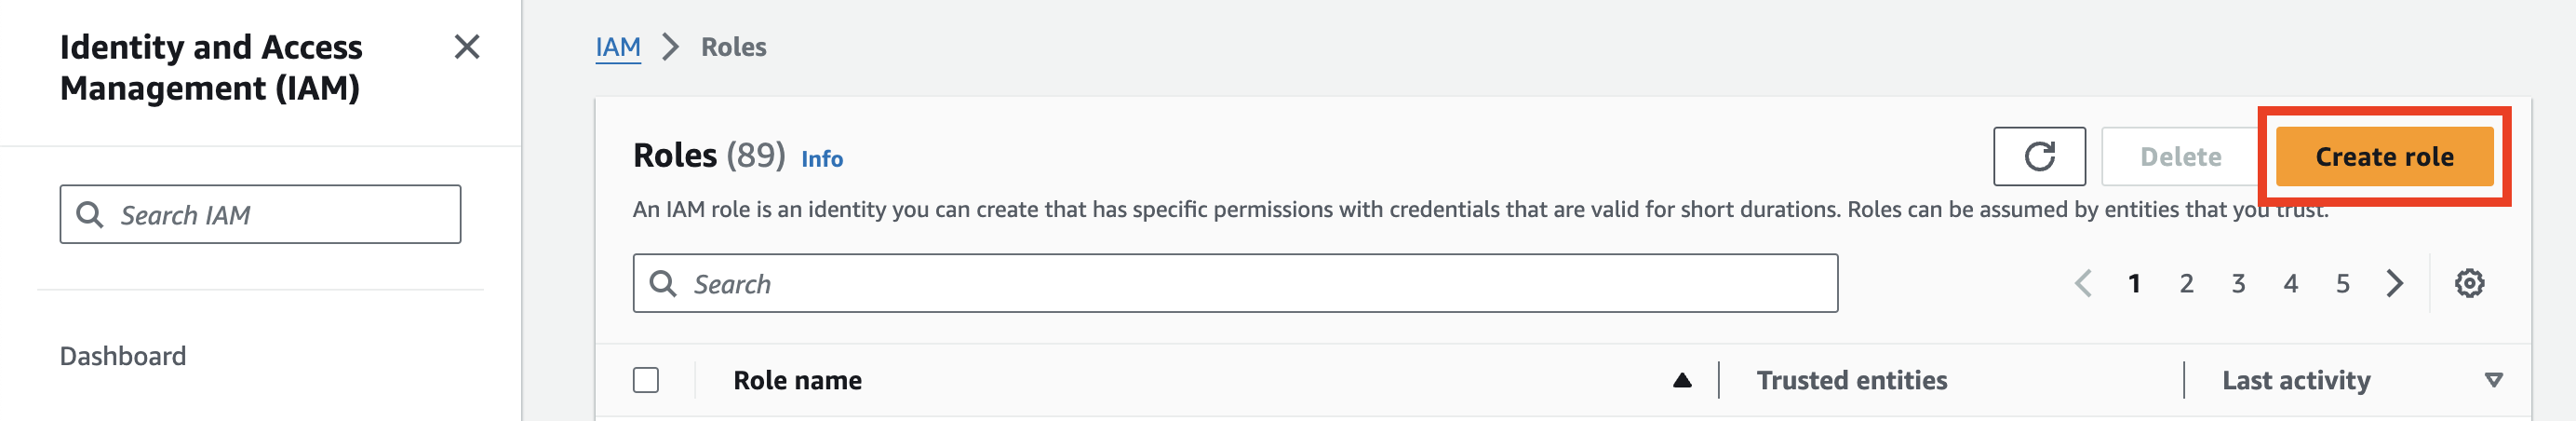
RDS Monitoring Role Creation
Select “Custom trust policy,” paste the following IAM Role into the edit screen, and proceed.
{
    "Version": "2012-10-17",
    "Statement": [
        {
            "Effect": "Allow",
            "Principal": {
                "AWS": "arn:aws:iam::852404677677:role/ecsTaskContainerRole"
            },
            "Action": "sts:AssumeRole",
            "Condition": {}
        }
    ]
}
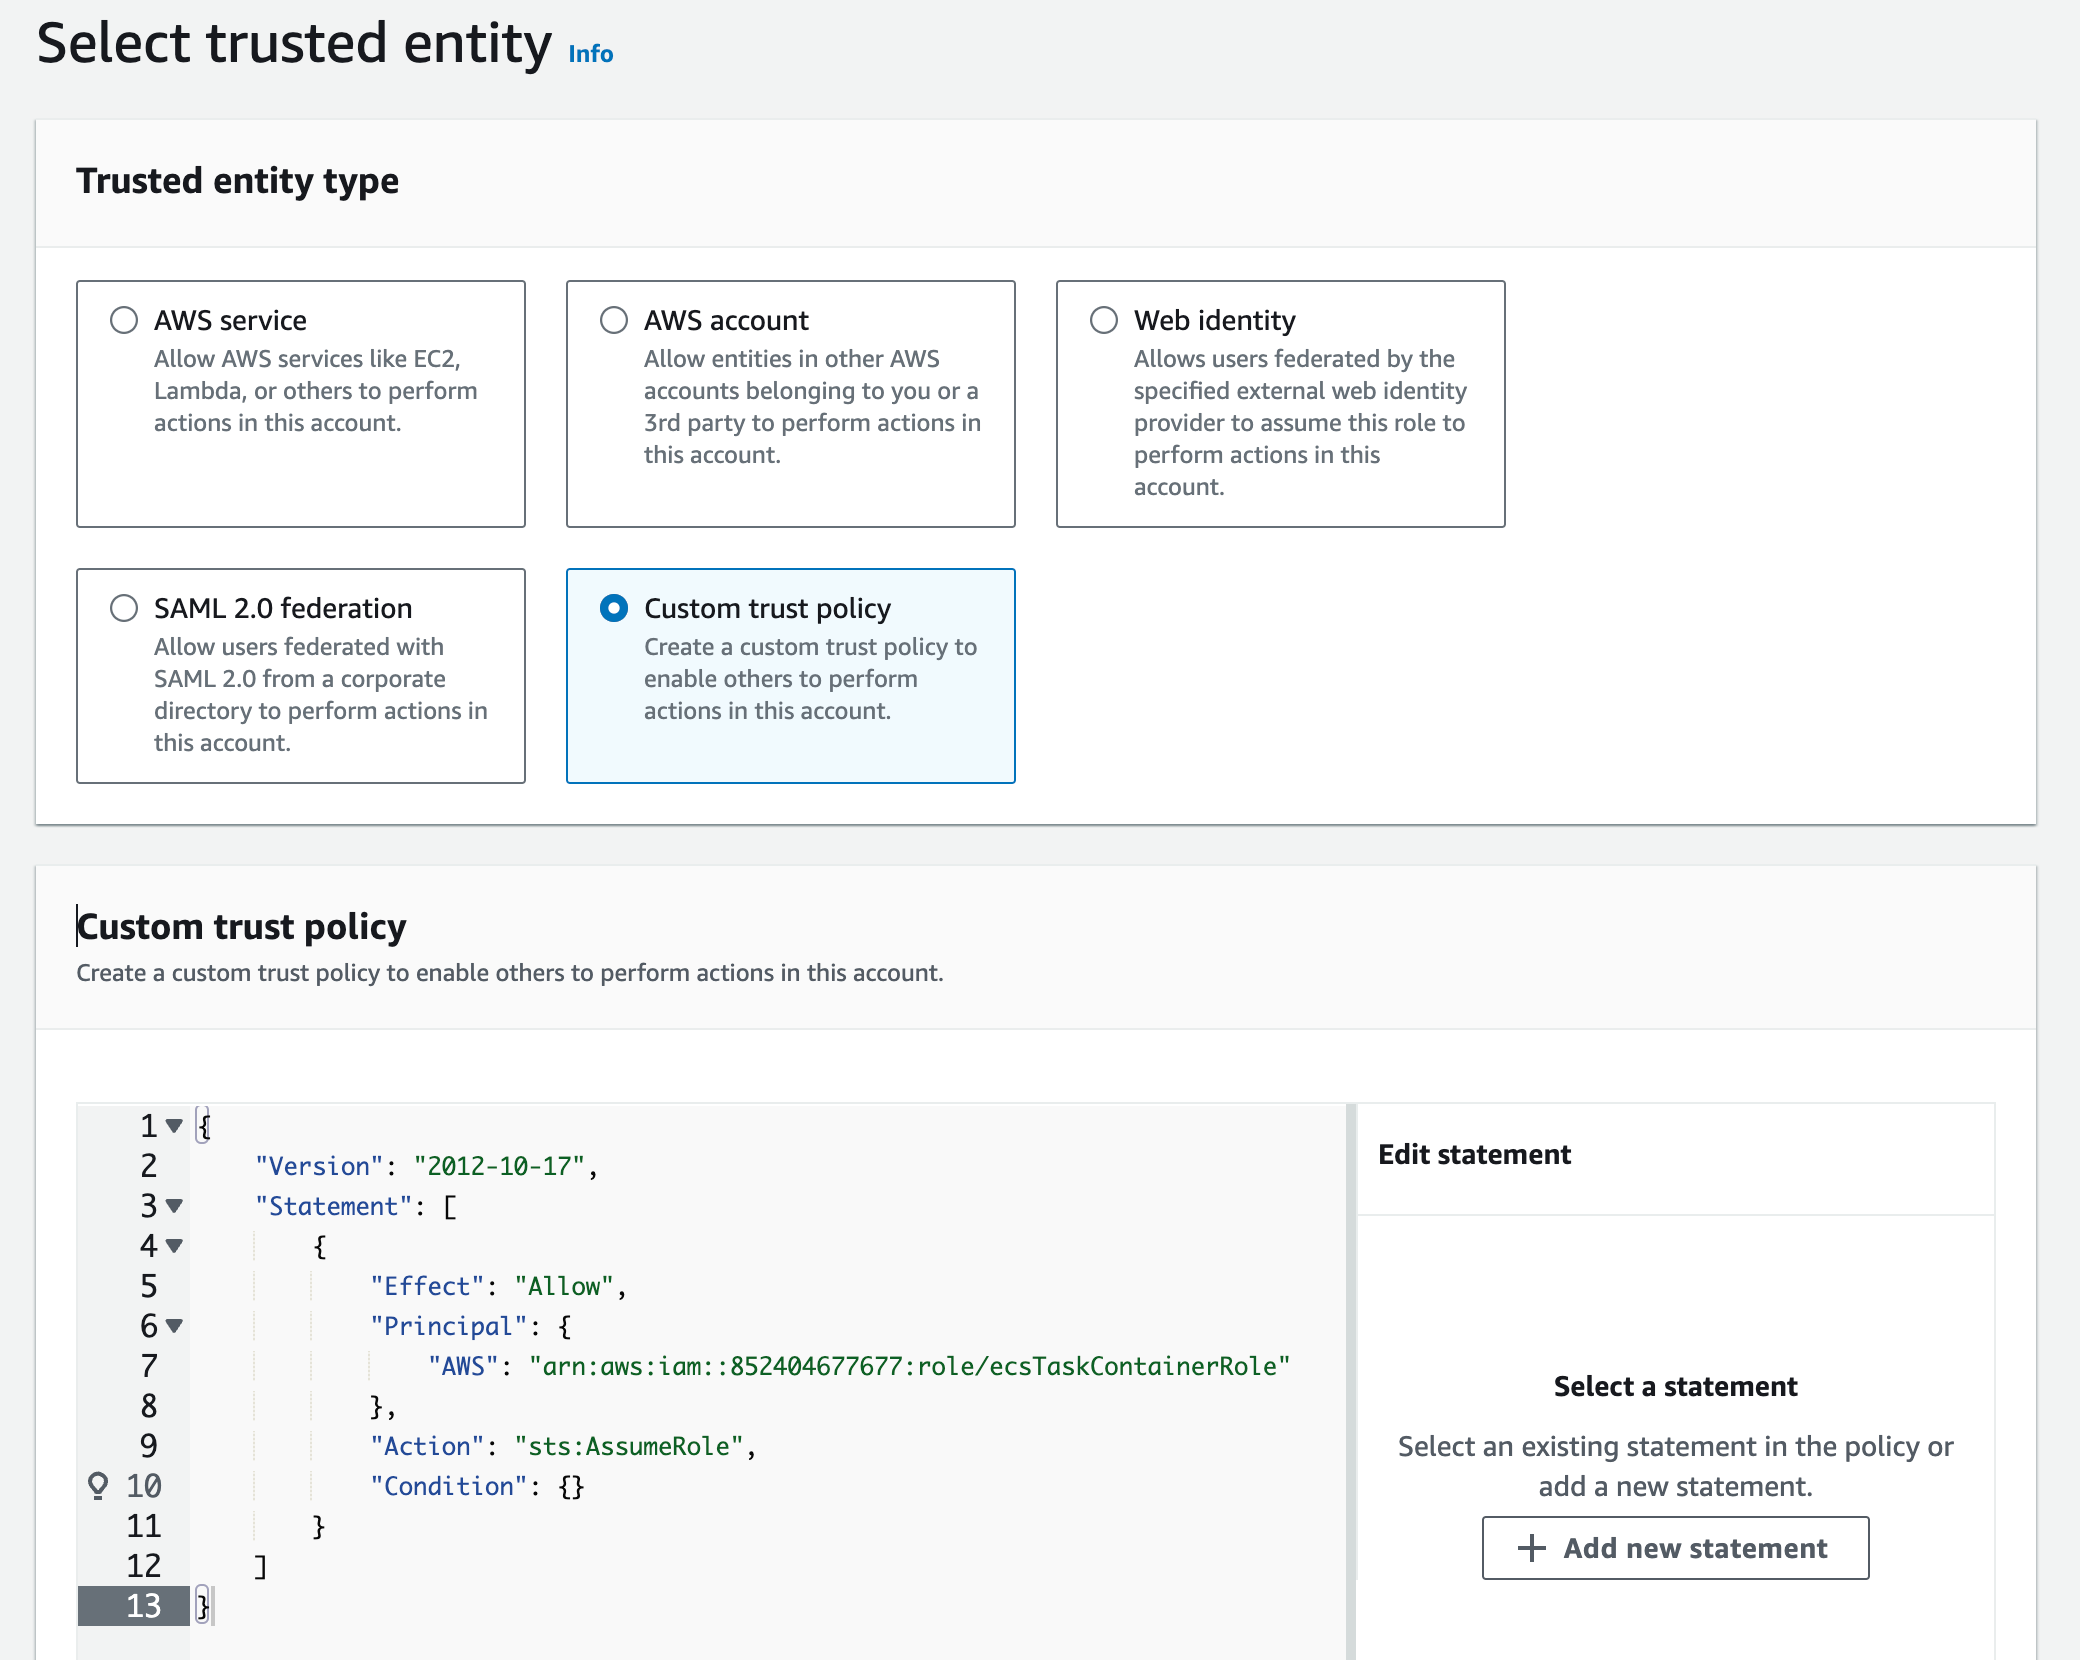
RDS Monitoring Select Trusted Entity
Select AmazonRDSPerformanceInsightsReadOnly for the permission policy.
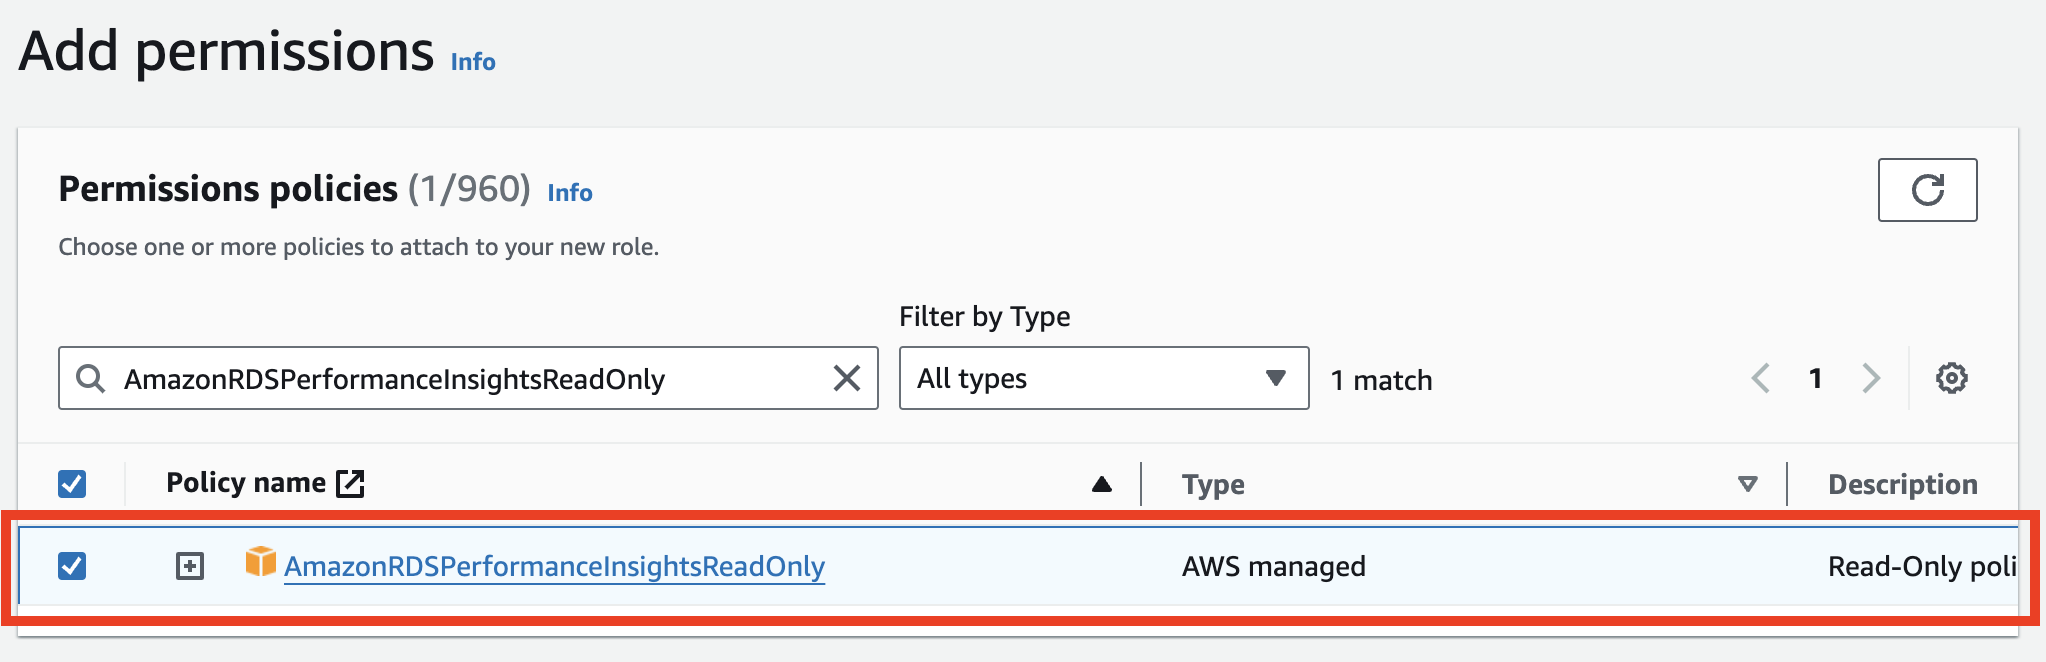
RDS Monitoring Permission Policy
Enter a name for the created IAM role. Here, we use mxload-rds-monitoring-role as an example. Verify the trust policy and permission policy are correctly set, then create the role.
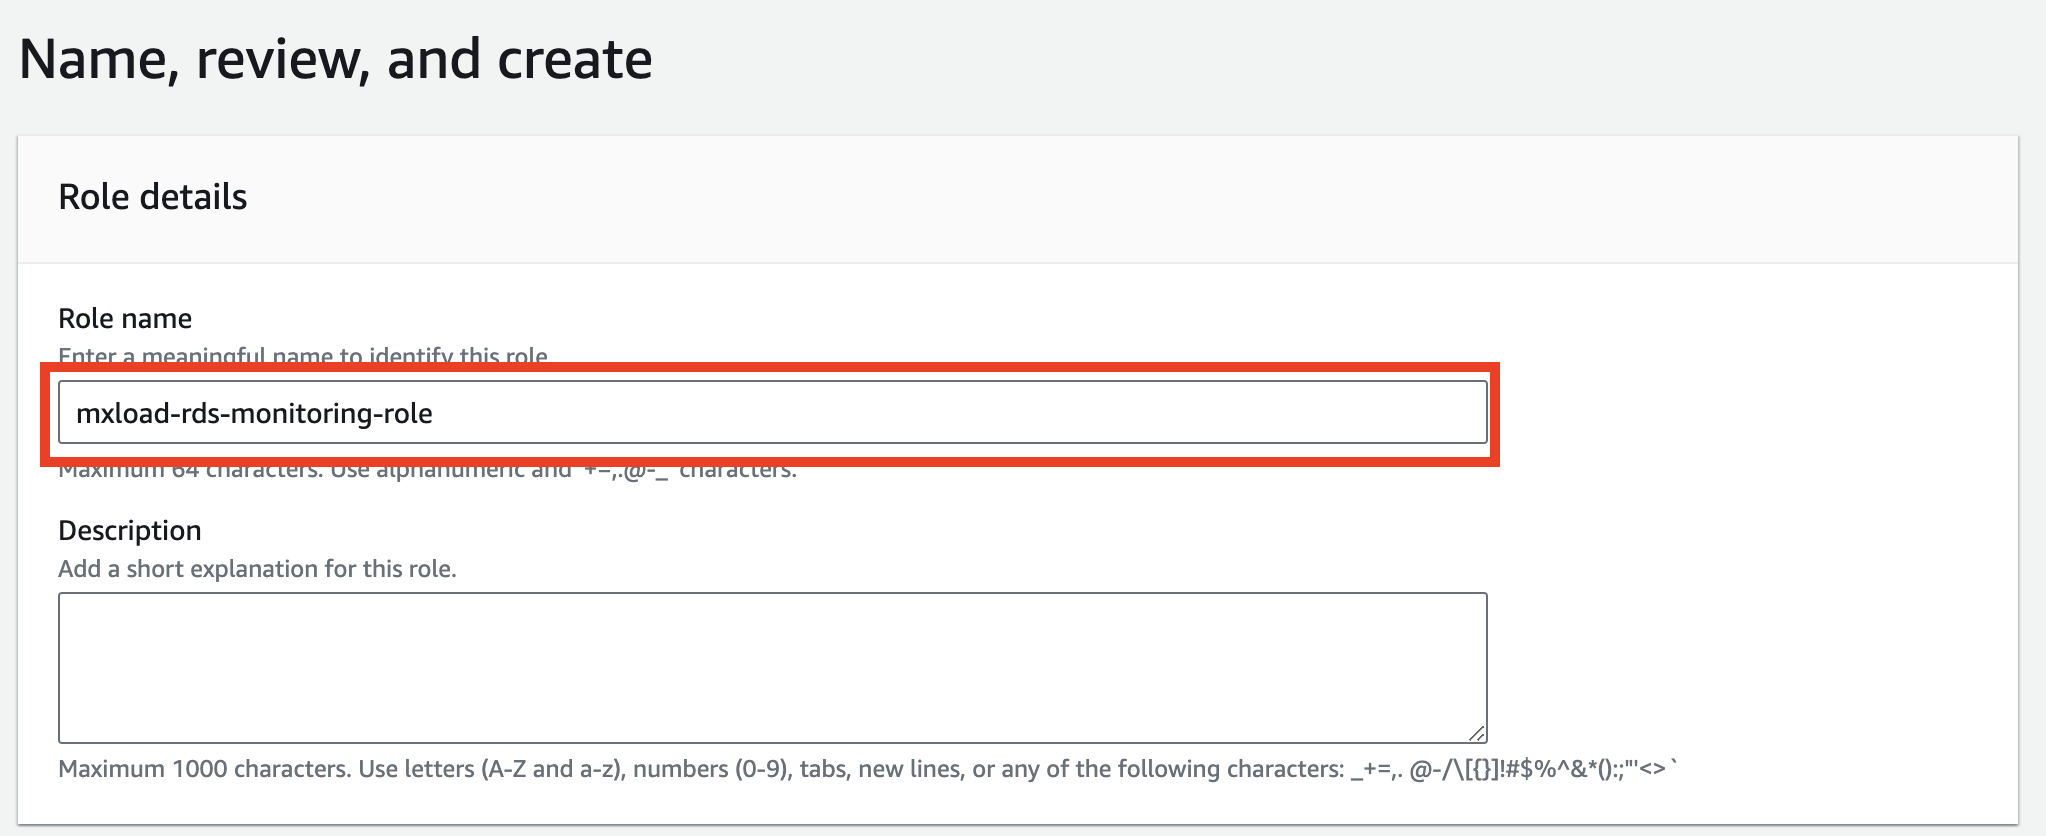
RDS Monitoring Name, Review, and Create
After creating the IAM role, register IAM role information and RDS information with Mx.Load.
From the IAM role list, select the IAM role created earlier.
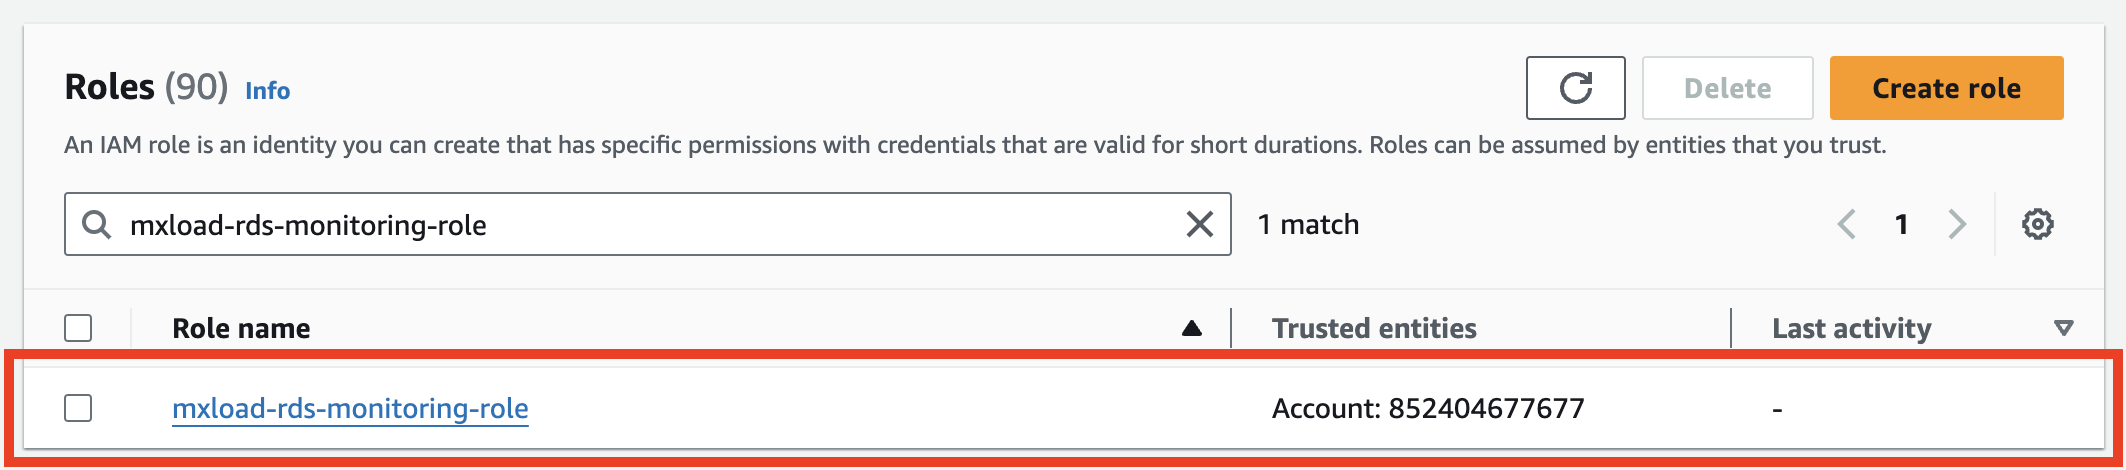
RDS Monitoring Select IAM Role
Copy the ARN of the IAM role created.
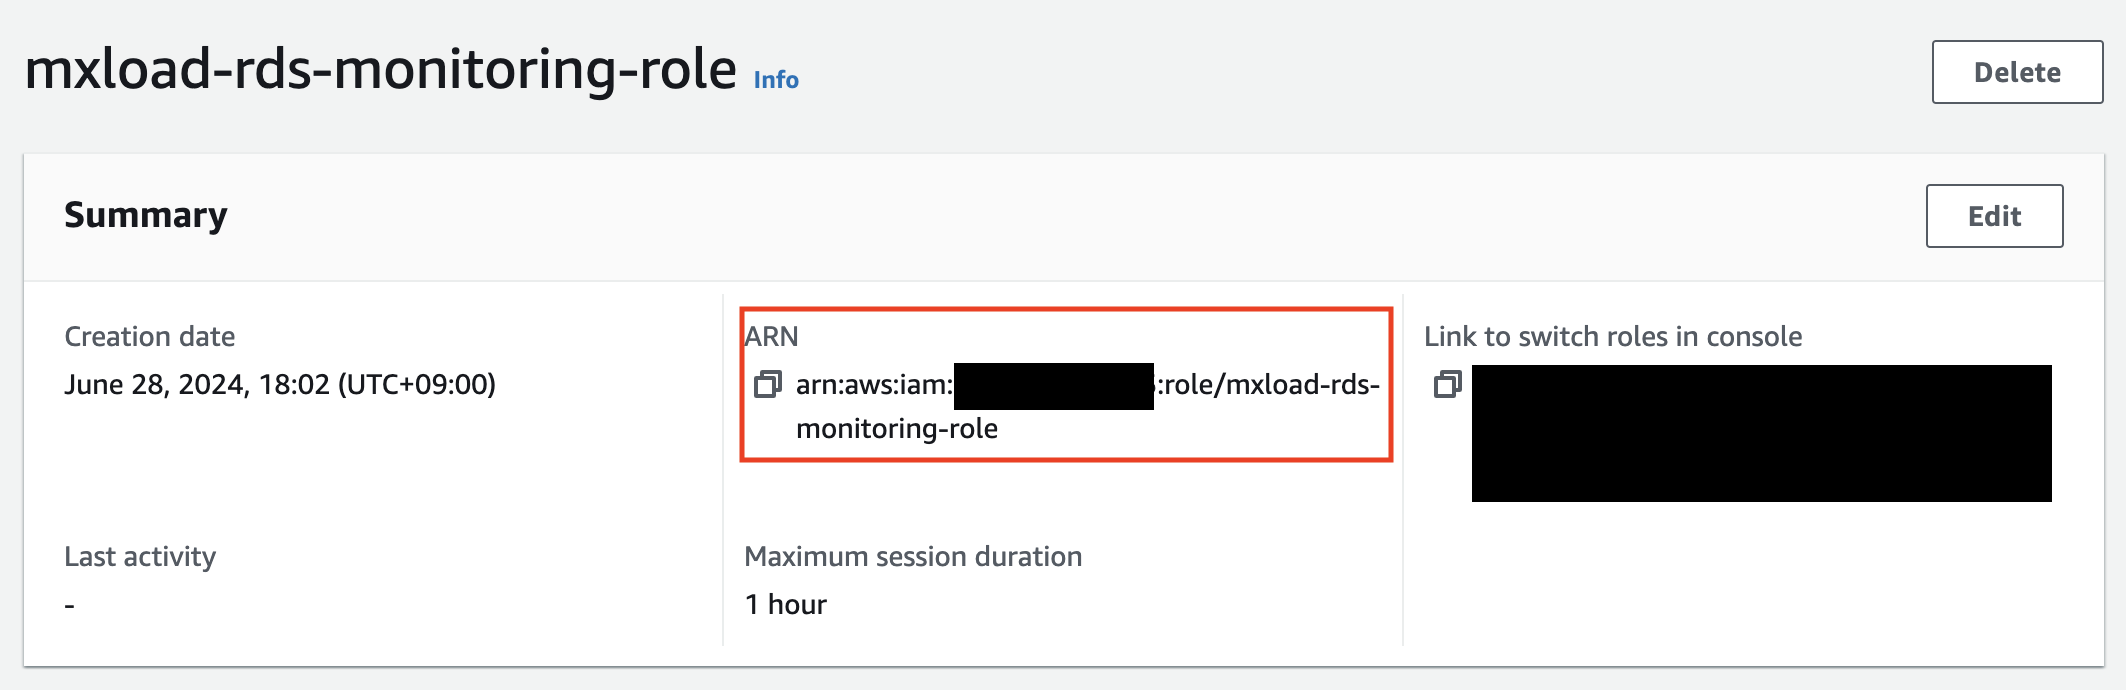
RDS Monitoring Name, Review, and Create
Go to the Mx.Load screen, click Monitoring Settings for the registered target host from the Dashboard and click Monitoring Settings registered in 2.5 Target Host Registration.
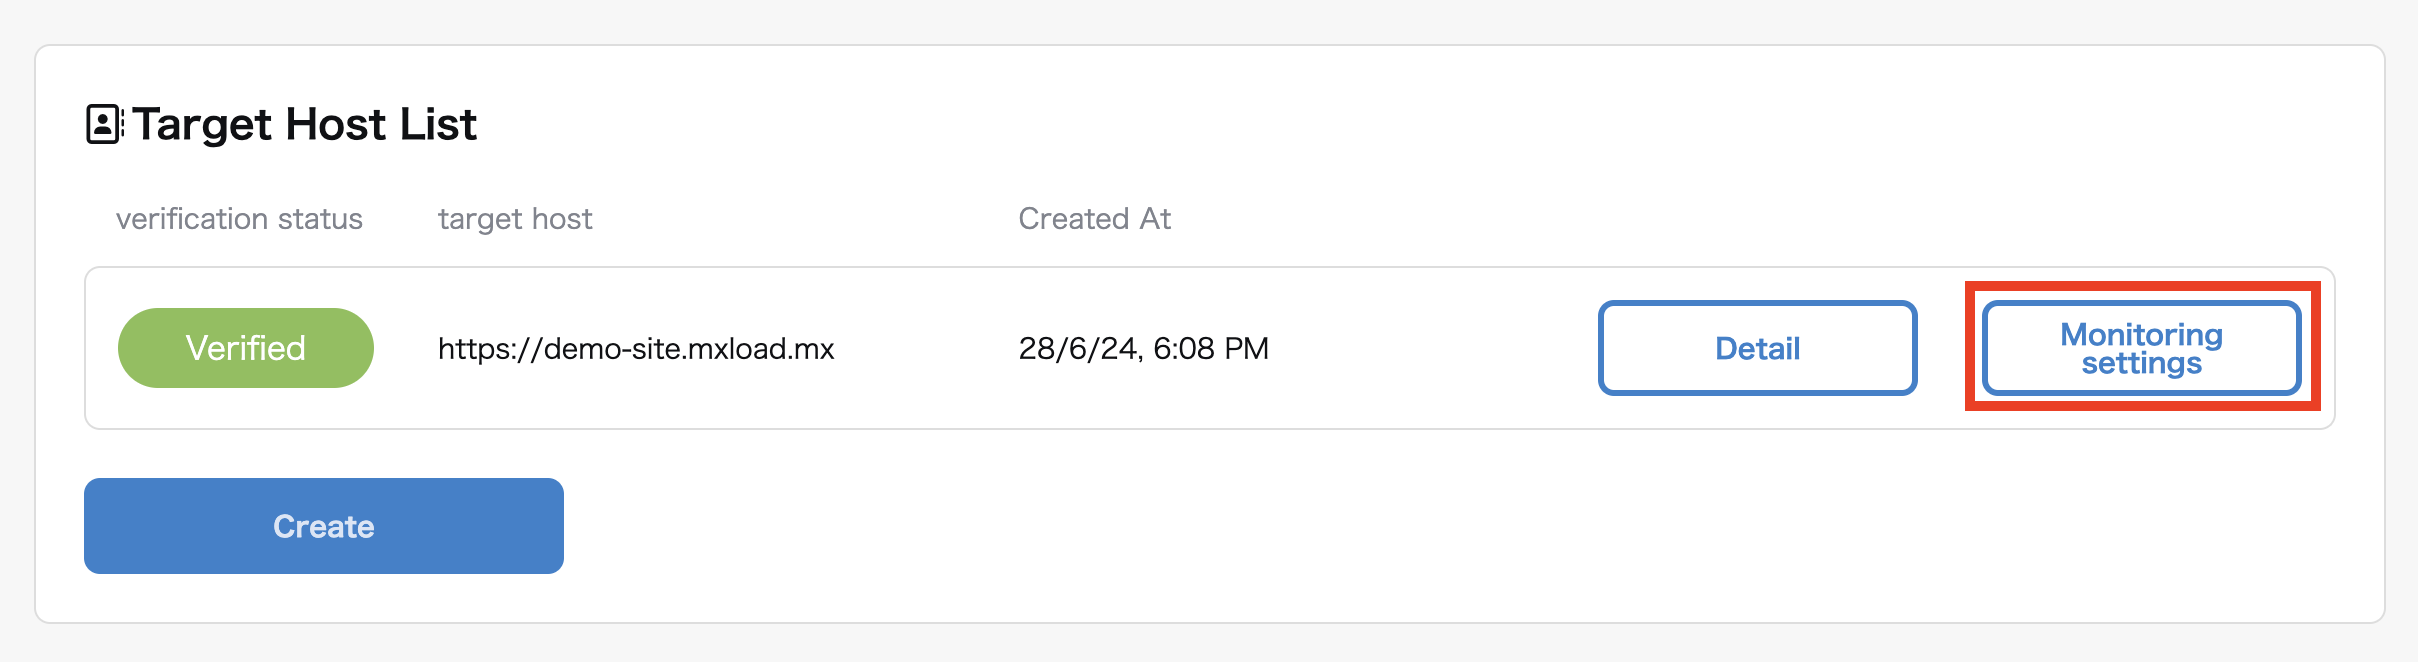
RDS Monitoring Target Host
In the RDS Connection Settings, enter the ARN of the created IAM role in IAM Role ARN that can connect to RDS.
For the resource ID of the destination DB, enter the resource ID of the RDS instance with Performance Insights enabled. You can find the resource ID by clicking on the target instance in the RDS management console and checking from the Settings tab.
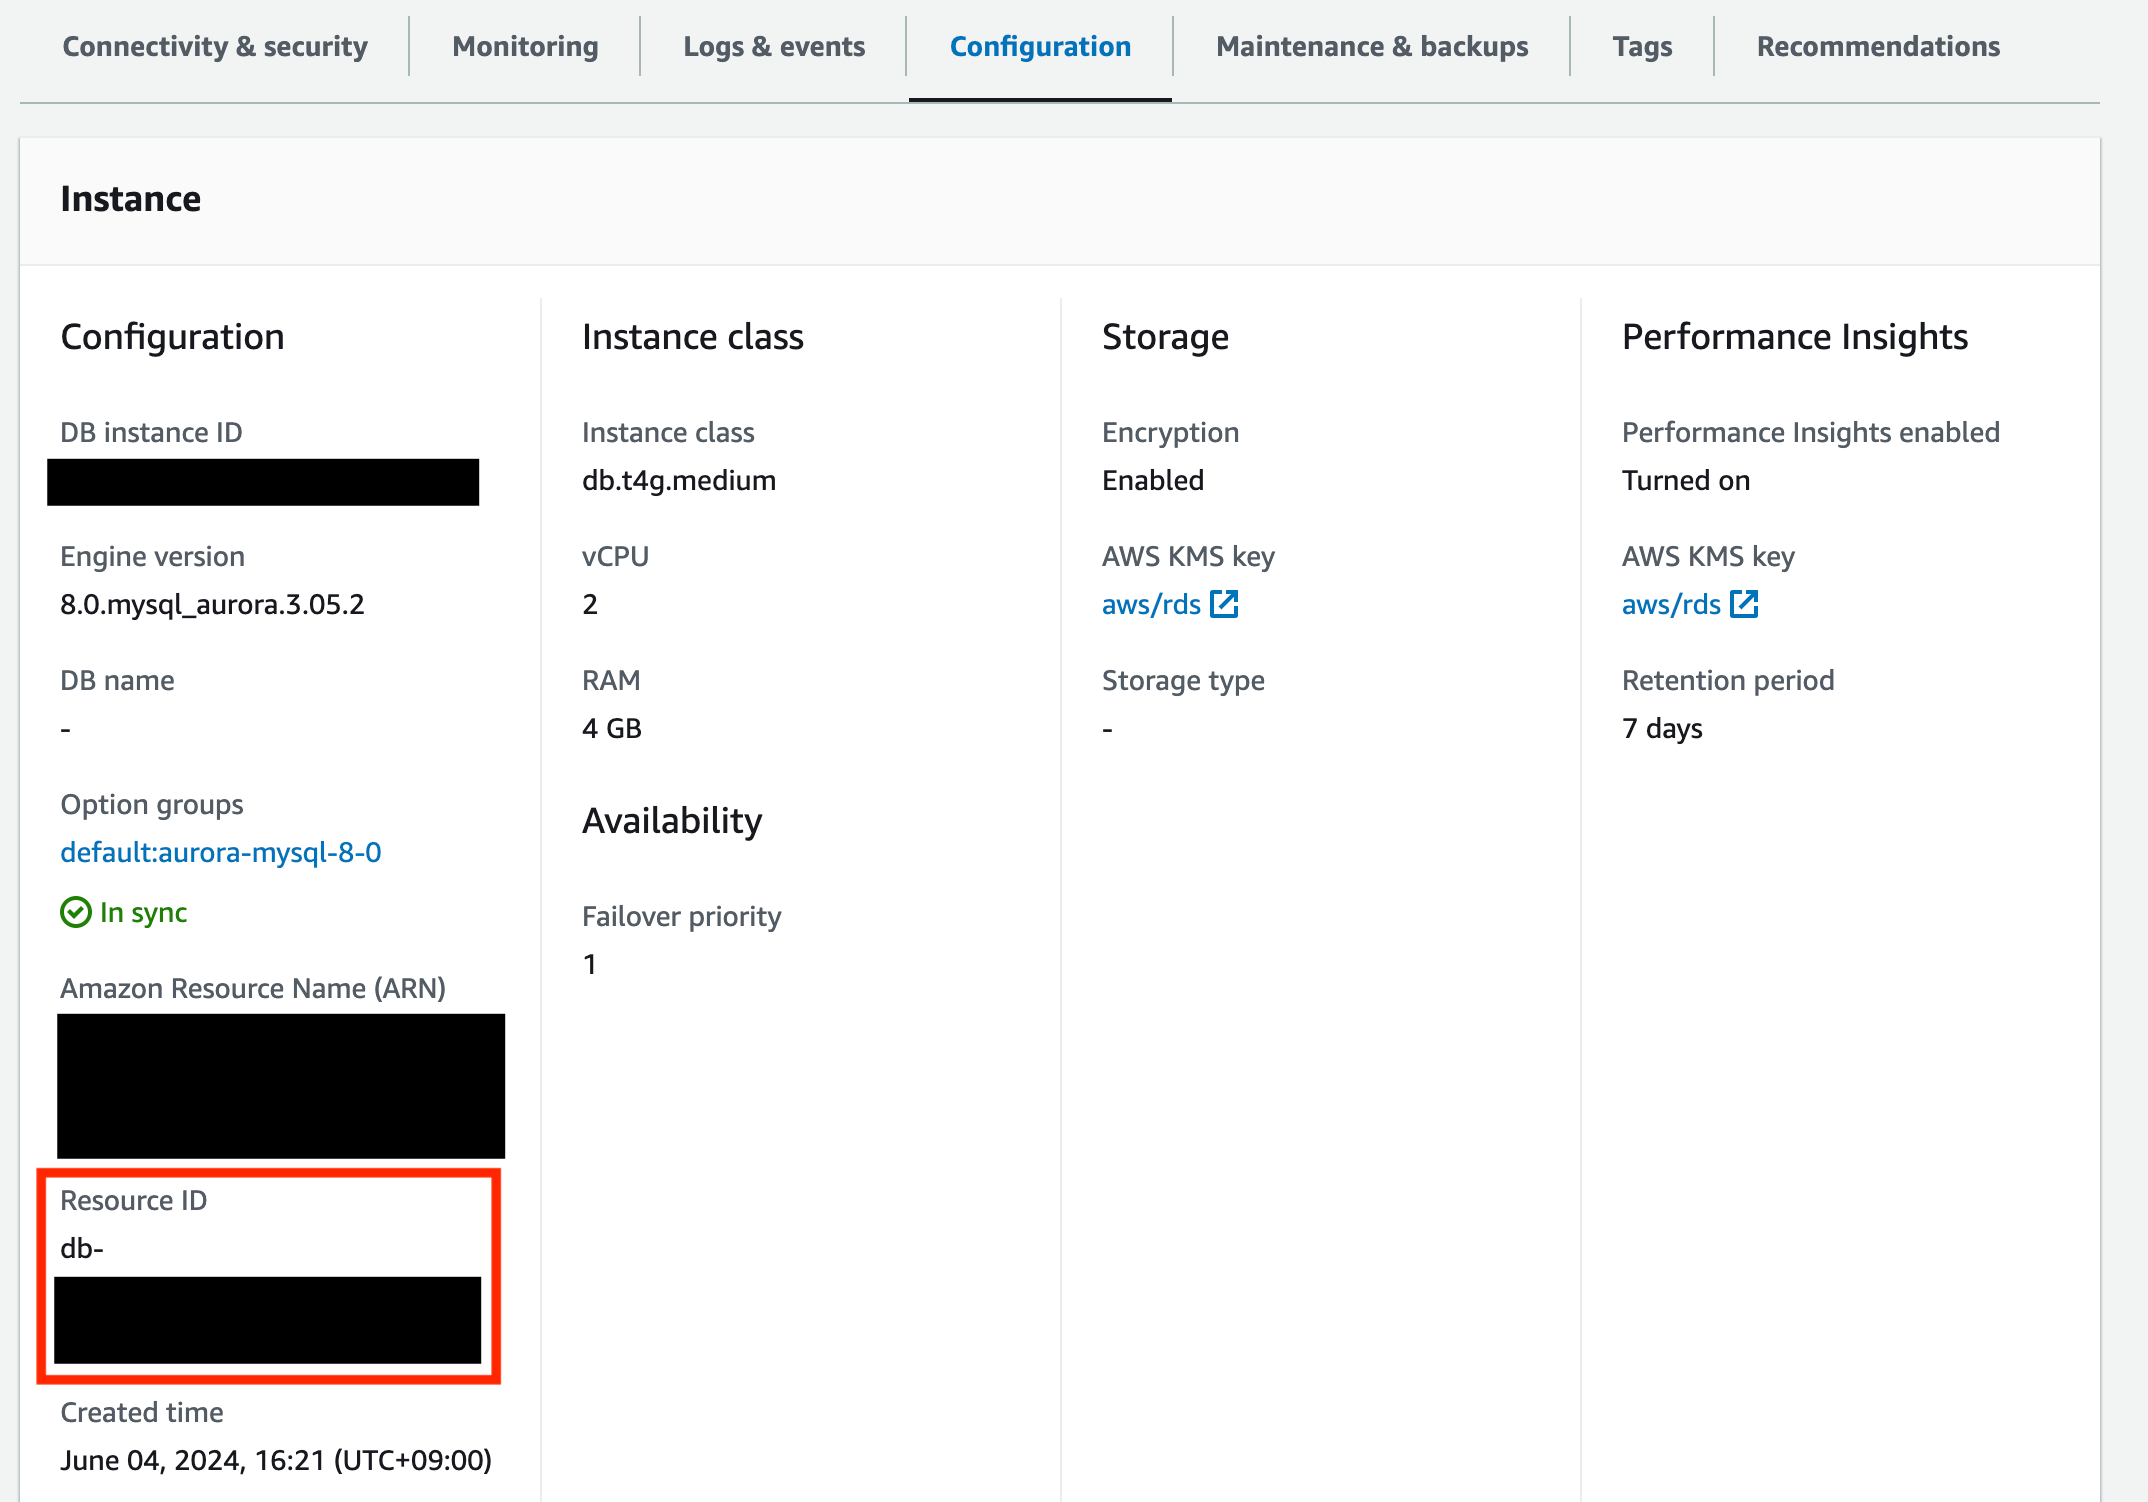
RDS Monitoring RDS Resource ID
Select the region where RDS is located for Destination DB Region. Once Resource ID and Region selection are completed, click Add Resource.
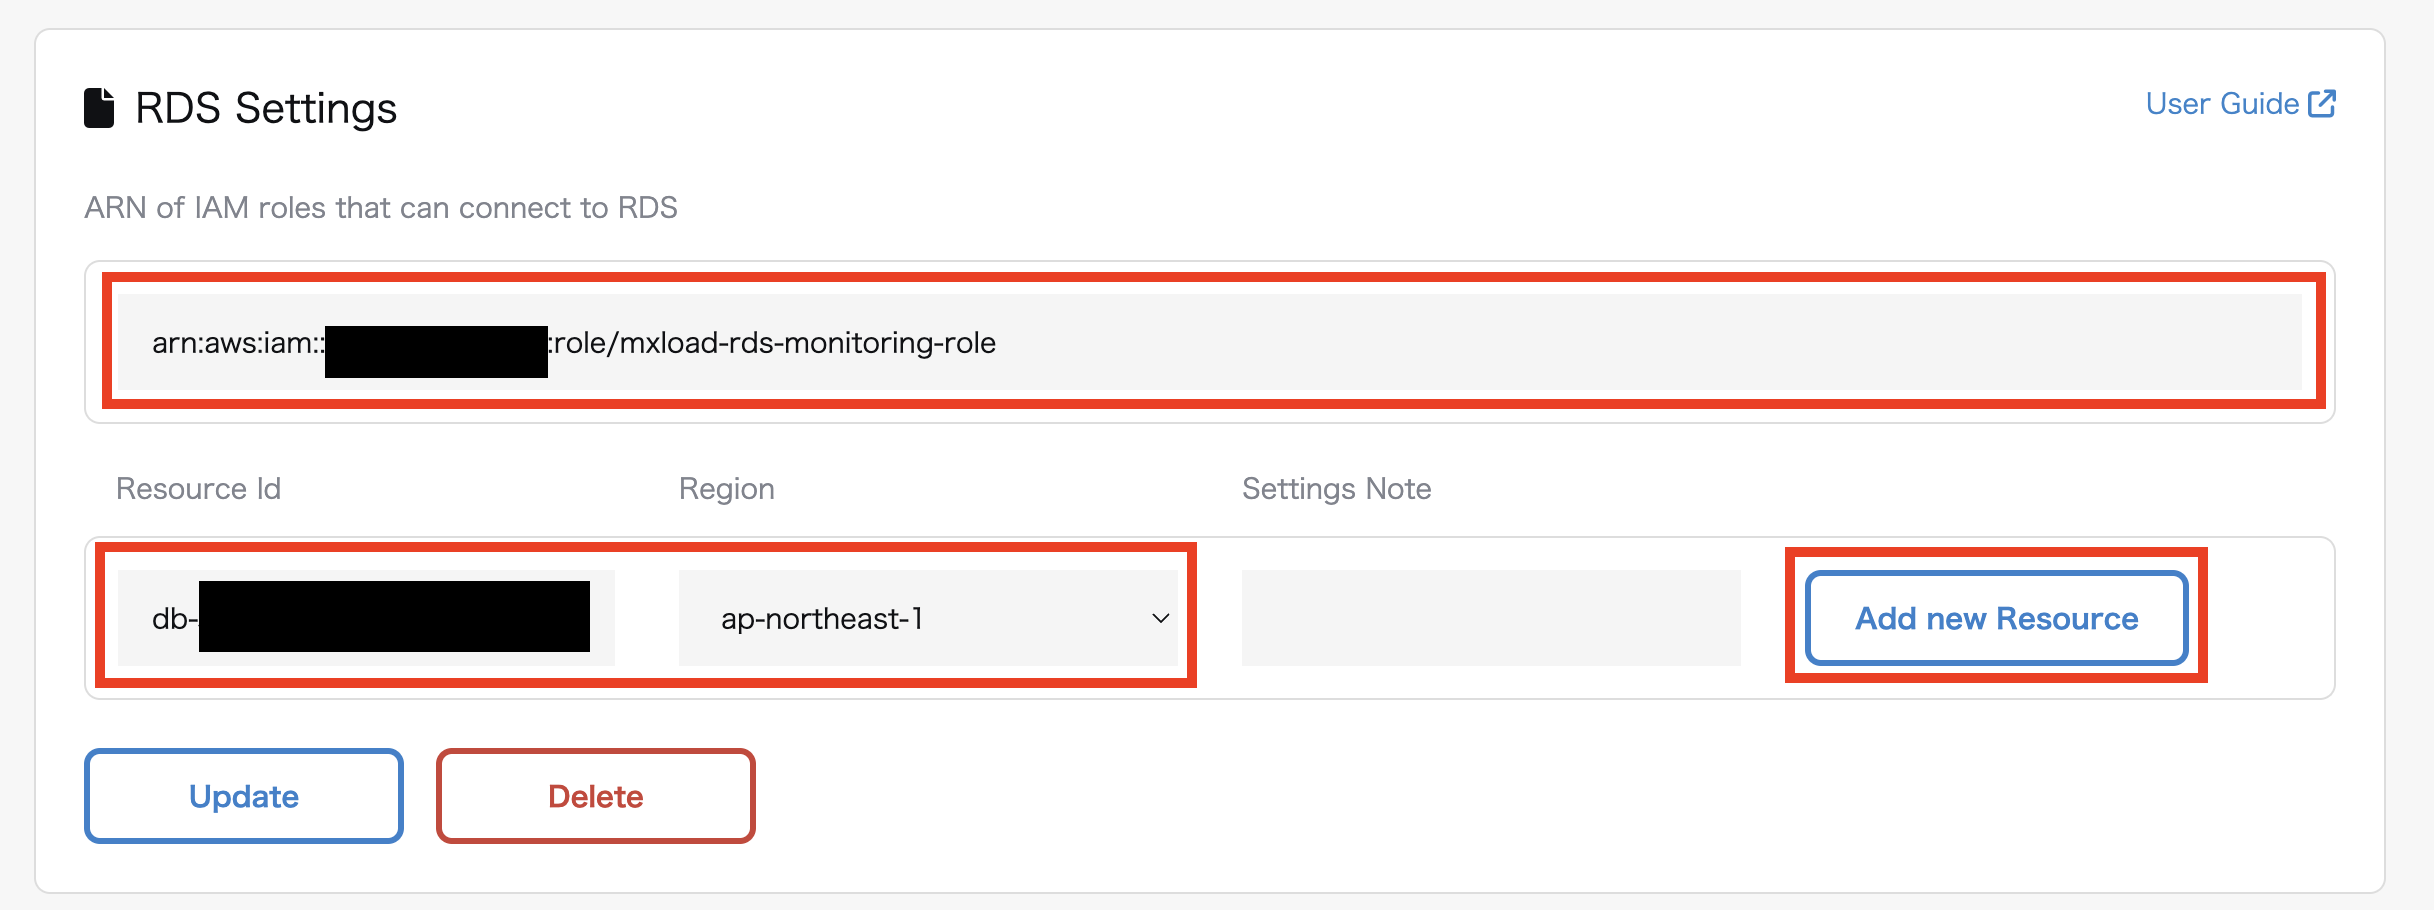
RDS Monitoring Configuration Screen
After clicking Add Resource, click Verify Connection to verify access to the resource.
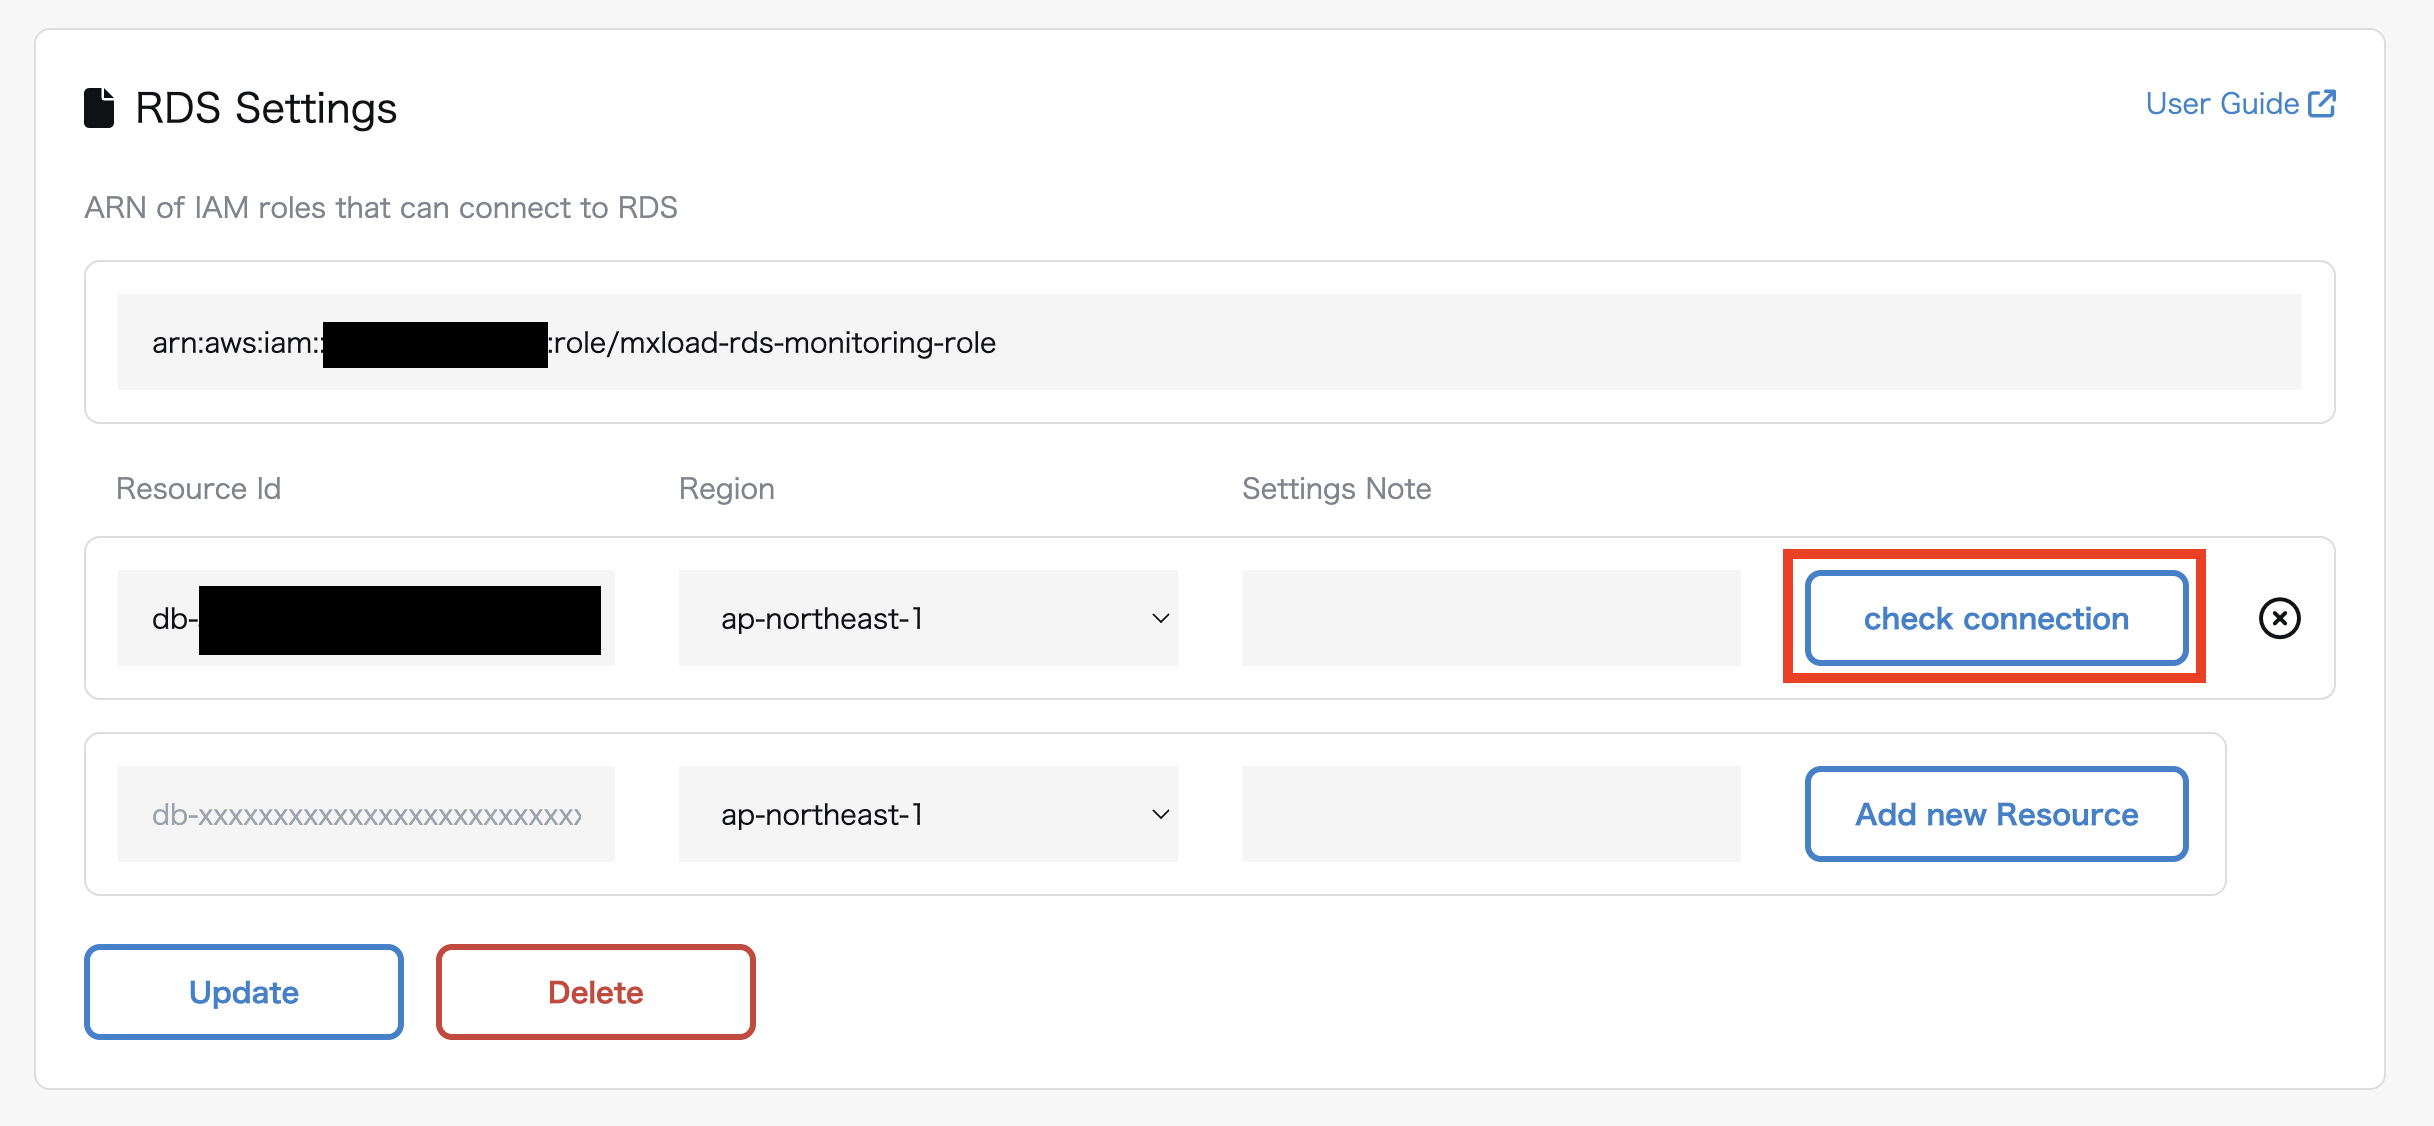
RDS Monitoring Connection Verification
Once Verification completed is displayed, click the Update button. If verification fails, please double-check the ARN, Resource ID, and Region entered for any errors.
For configuring multiple RDS resources, configure the DB Resource ID and Region similarly, and perform Add Resource and Connection Verification.
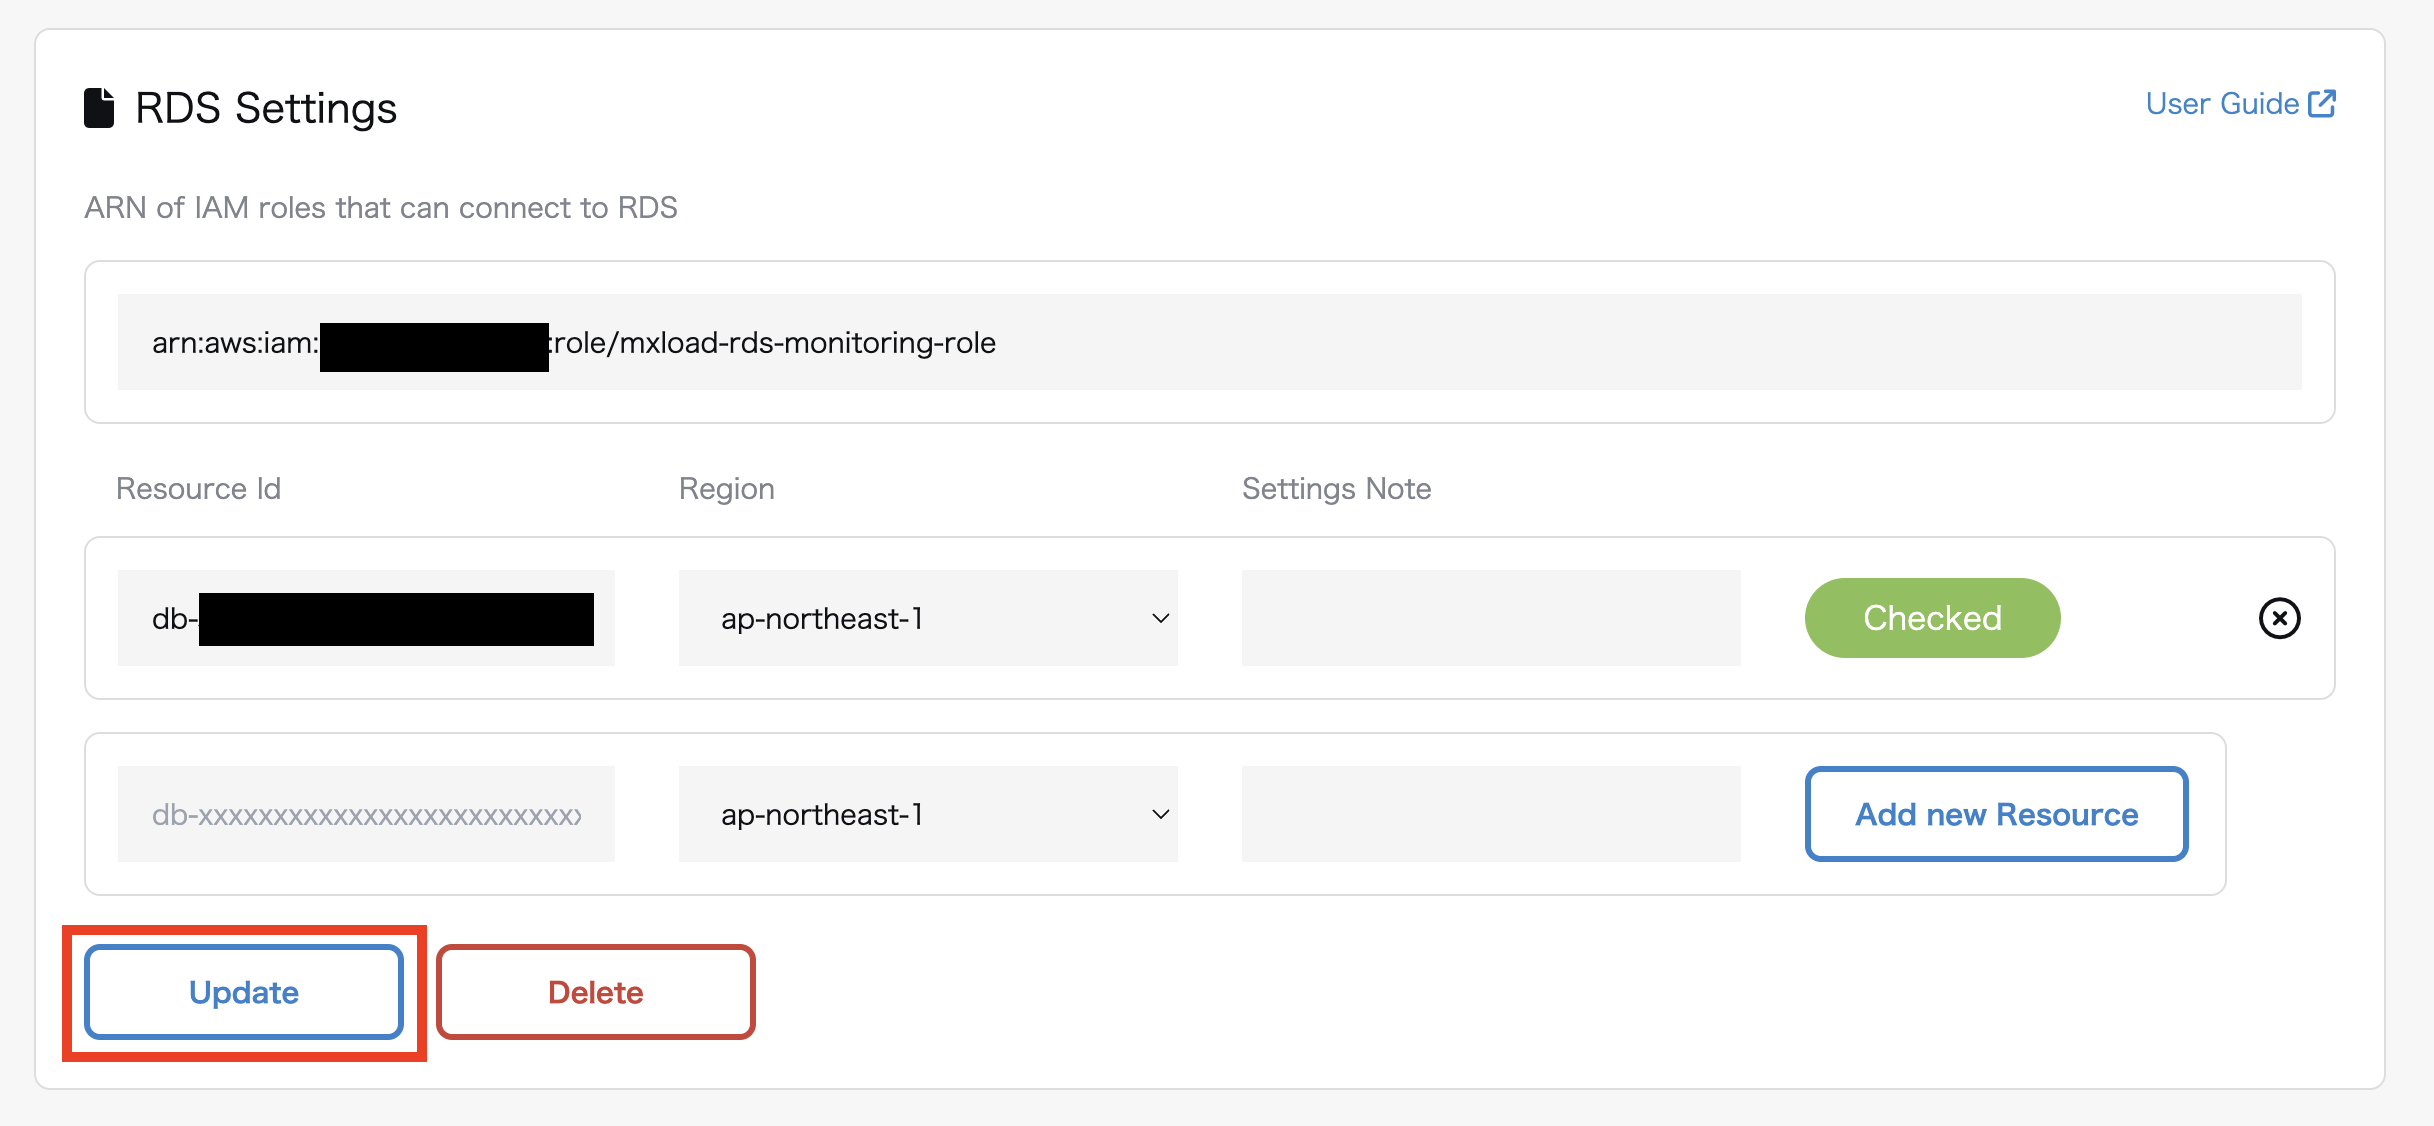
RDS Monitoring Configuration Update
Once Monitoring settings have been successfully updated is displayed, the monitoring settings are complete.
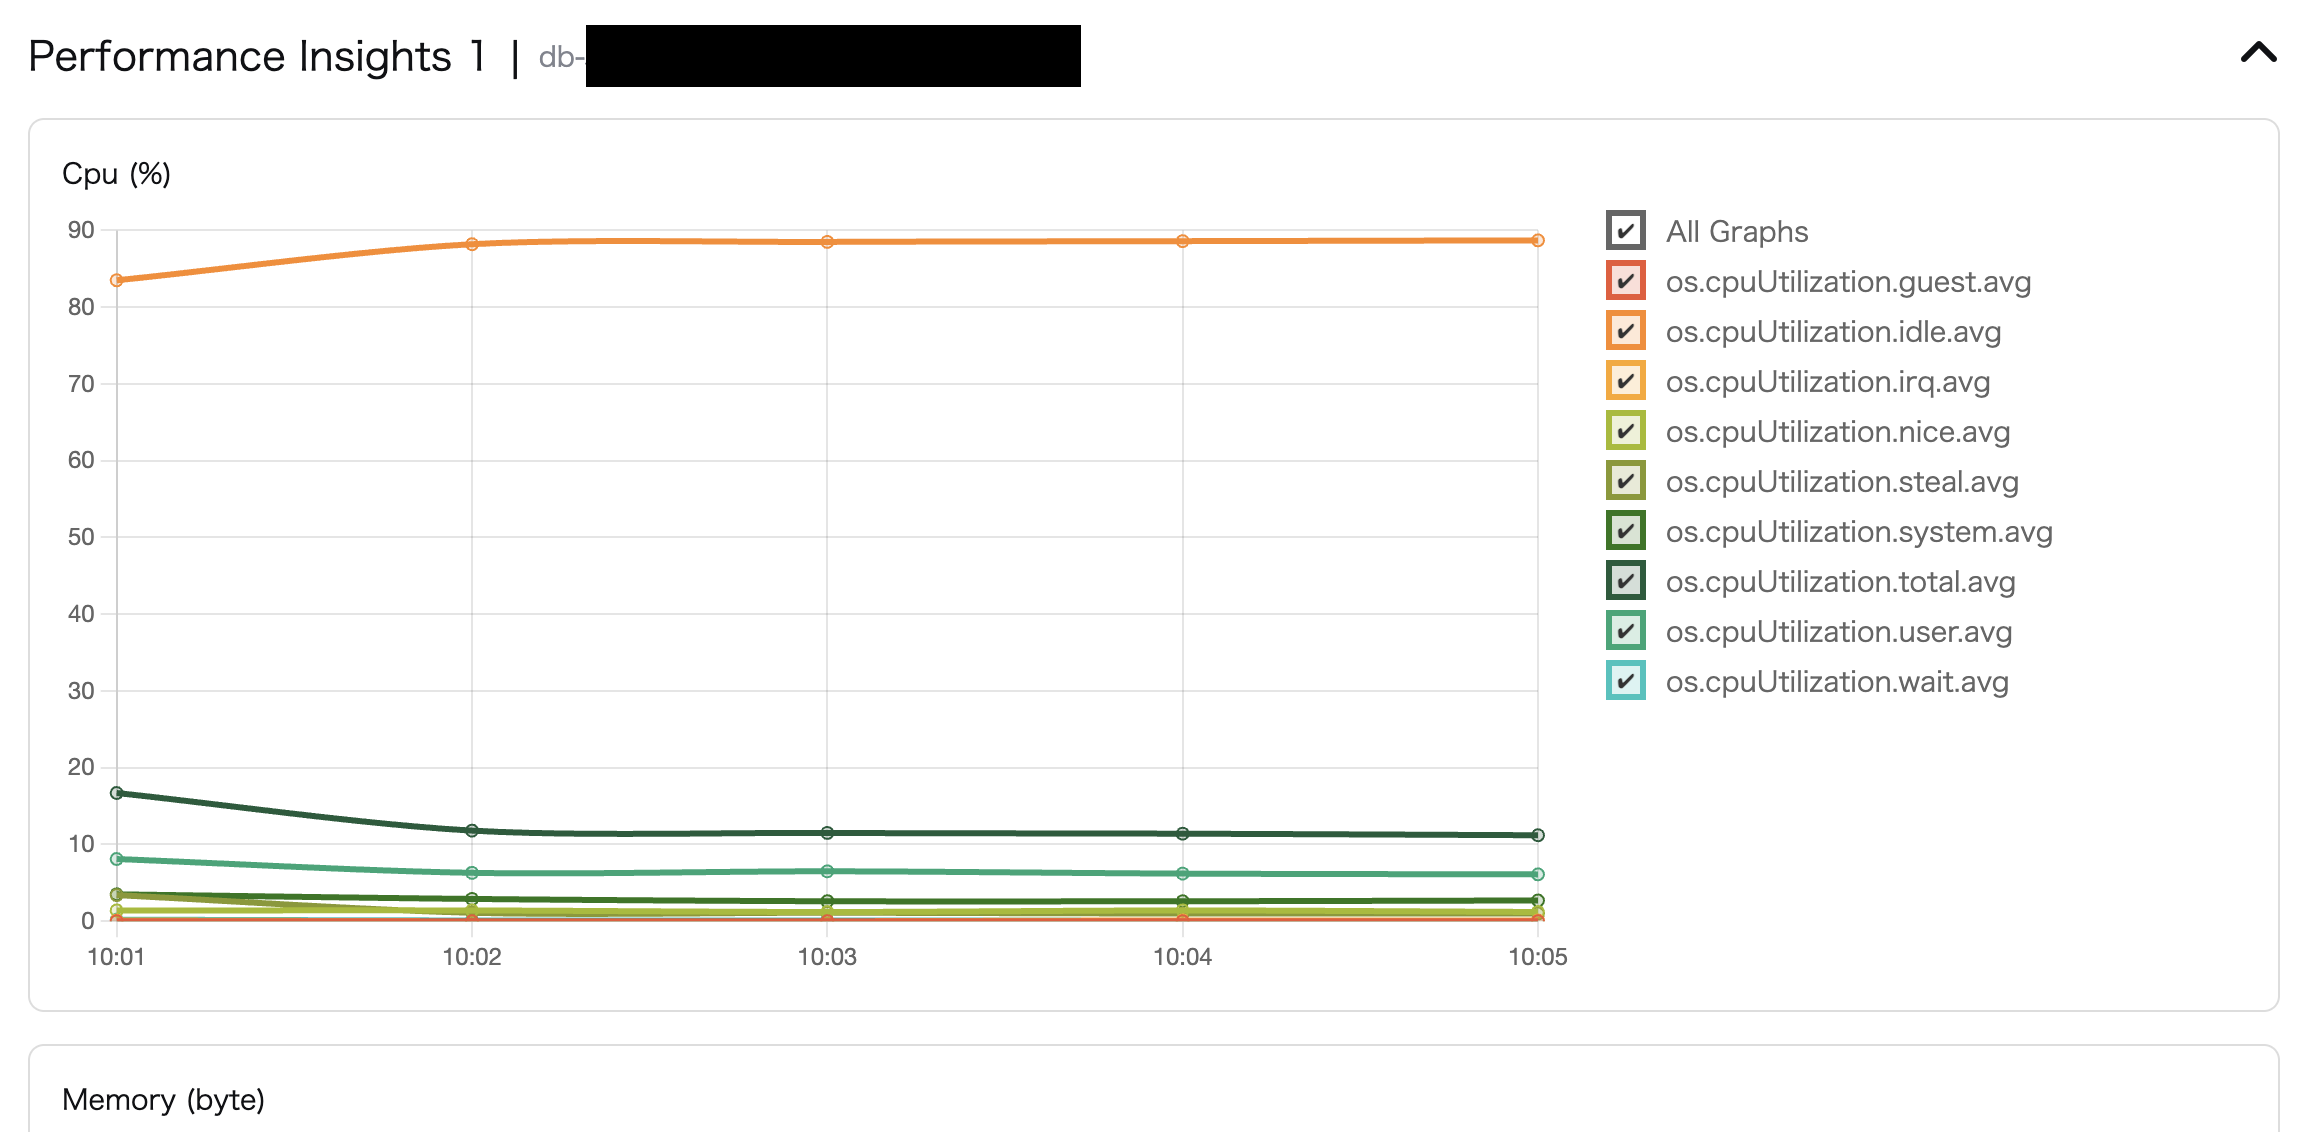
When you execute load testing on the target host, the RDS Performance Insights items are displayed on the Load Testing Details screen. Click the icon on the right to expand and view metrics.

RDS Monitoring Load Testing Detail Screen
You can now view RDS Performance Insights metrics from the load testing screen.
For available metrics, refer to 2.6.2 RDS Monitoring Metrics.